FATE
Factory
Simulation

FATE is the leading Argentinian company in tire manufacturing and export. It is part of an important Argentine business group together with Aluar, the only primary aluminum producer in the country and the main manufacturing company of this metal.
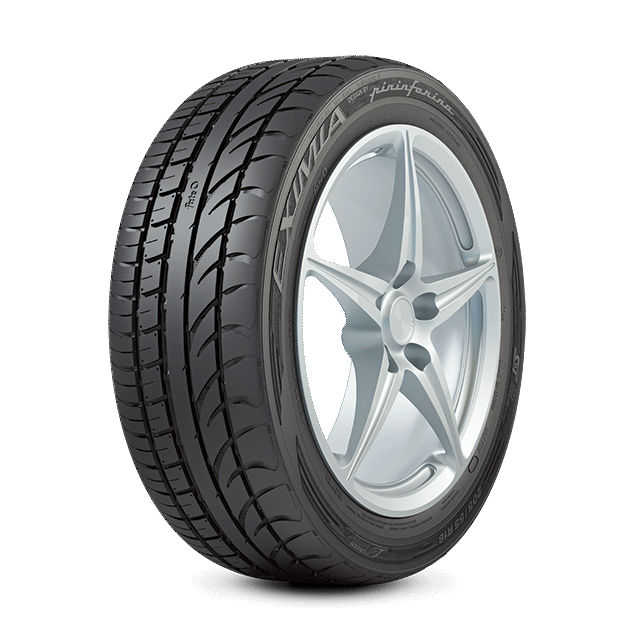
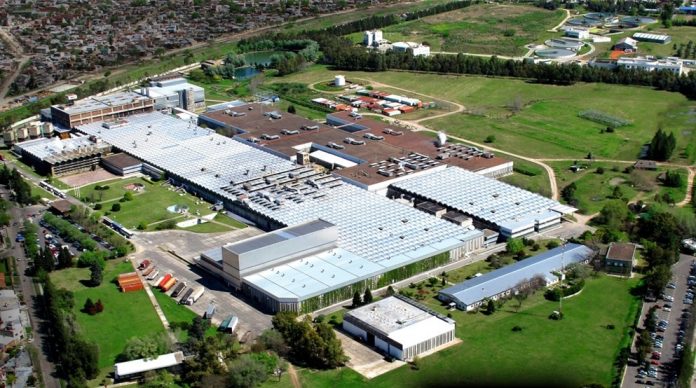
The FATE tire industrial plant is the largest and most modern in Argentina, with a production capacity that exceeds five million tires per year.
Case Presentation
Challenges
Quantitative analysis
Quantitative analysis
Need to quantitatively analyze different policies, investments and change requirements.
Modeling
Modeling
Modeling of highly complex system due to the many processes required to manufacture a tire and the nature of such processes.

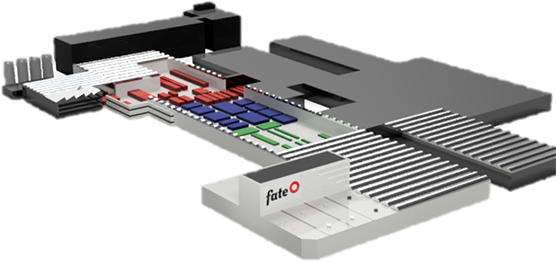
The model includes
- 4 consecutive manufacturing subsections.
- 16 machine types, each with its own scheduling logics and particular behaviors.
- Conveyor belts with different operation criteria.
- Storage areas associated to each machine and product type, including particular storage logics.
- Great diversity of movement equipment and vehicles, and its logics to transport products.
- Machine staff and task assignment. Transportation staff, including material movement logics between storage areas.
Methodology
Multiparadigm simulation
Multiparadigm simulation
Discrete Event and Agent Based Modeling
Control variables
Control variables
- Work schedules
- Bill of materials
- Staffing and task assignment
- scraps
- Productivity by product-machine
- Efficiencies and random stops parameters
- Storage areas
- Tool availability
- Machine setups
- Movement equipment and vehicle availability
- Initial stock
- Conveyor parameters
Statistical analysis
Statistical analysis
to analyze stochastic behaviors, such as process interruptions, quality problems, performance problems, etc.
3D animation
3D animation
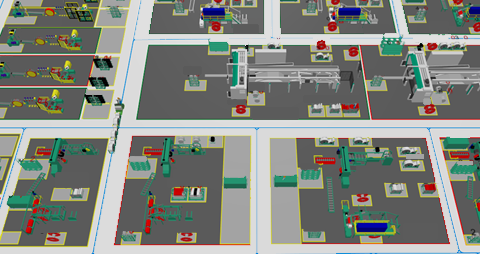
of the whole factory sector to facilitate the model interpretation and to study the dynamisms of its behaviors.
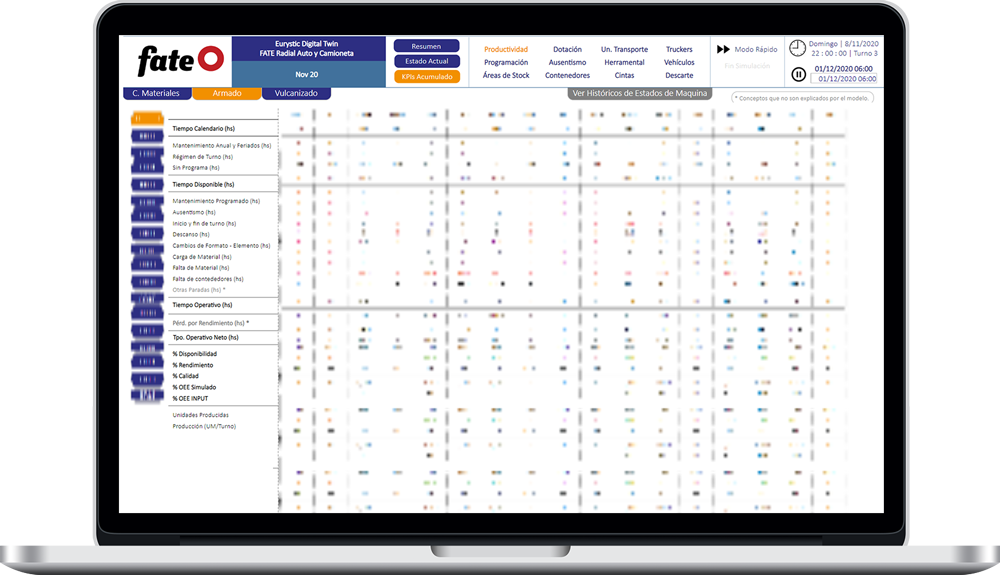
Standalone simulator that allows its execution by inputting data from the client’s systems, and the generation of KPIs and reports for its analysis.
System status indicators
State of each machine
Conveyor state
Active staff
Storage areas state
Movement staff position and task
Movement equipment and vehicles state
KPIs
- Production, losses and efficiency details
- Machine state evolution time chart
- Applied machine task schedules
- Storage areas. Utilization charts and indicators.
- Staff
- Shift by shift utilization and task distribution charts and indicators.
- Absenteeism indicators.
- Scraps
- Movement equipment and vehicles. Utilization charts, average filling and bottleneck alerts.
- Tooling. Utilization charts and bottleneck alerts.
- Conveyors. Flow and dwell time indicators.
- Movement operators. Various utilization indicators and movement efficiency.
- Bottlenecks and their possible causes reports.
- Production mix, absenteeism, storage saturation, tooling, and staff alerts.